
We decided to investigate SPX calendar spreads from 2007 to present. More specifically, we wanted to know how frequently unmanaged SPX calendar spreads reached specific profit and loss levels relative to the initial debit paid. The results can be used for practical use of the calendar spread strategy.
Study Methodology
Here are the specifics of the test:
Time Period: January 2007 to Present
Trade Setup: On each trading day, locate the standard expiration cycle with 30-45 days to expiration. If the front-month standard expiration cycle did not fall within that time frame, we simply did nothing and proceeded to the next trading day.
When the front-month expiration cycle fell between 30-45 days to expiration, we “sold” the at-the-money put in that cycle. In the following standard expiration cycle, we purchased the put at the same strike price to complete the calendar spread.
Position Tracking: Each position’s profit/loss as a percentage of the debit paid was tracked on each trading day until the day before settlement. We did this to avoid any unwanted outcomes as a result of the SPX settlement process.
Overall, 1,200 SPX calendars were tracked.
Once all of the profit/loss metrics were gathered, we filtered the trades into four buckets based on the VIX Index level at the time of entering the trade:
- VIX Below 15
- VIX Between 15 to 20
- VIX Between 20 and 25
- VIX Above 25
Each bucket had a similar number of occurrences.
The Results: Profit/Loss Frequencies for 30-45 DTE SPX Calendar Spreads
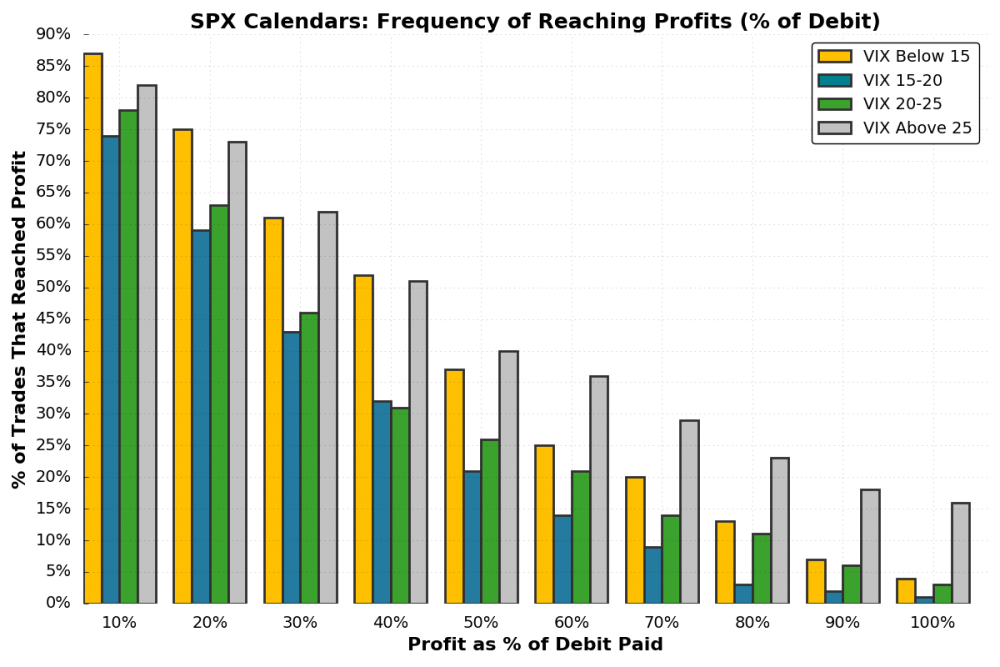
Let’s take a look at the data! We’ll start with the percentage of calendar spreads that reached profit levels between 10-100% of the initial debit paid:

There are some key findings from these results:
- Over 50% of the trades reached returns of 40% or more on the initial debit paid, with 75% of the positions reaching 10-20% returns on the debit paid.
- The low IV (VIX below 15) and high IV (VIX above 25) had the highest percentage of trades that reached each profit level.
High IV calendar spreads in second place? How can that be?
In super high IV environments, the VIX term structure (SPX volatility) goes into backwardation. As a result, the near-term expiration cycles trade with significantly high er implied volatility than longer-term expiration cycles. When volatility comes back down, the front-month implied volatility will fall with greater magnitude than the back-month implied volatility, which can lead to quick profits on a calendar spread if the underlying hasn’t moved too much. The only problem is that in high implied volatility environments, realized volatility tends to be high, which is not ideal for delta-neutral calendar spreads.
So, in high IV, long calendar spreads become more of a term structure reversion trade, and less of a time decay trade.
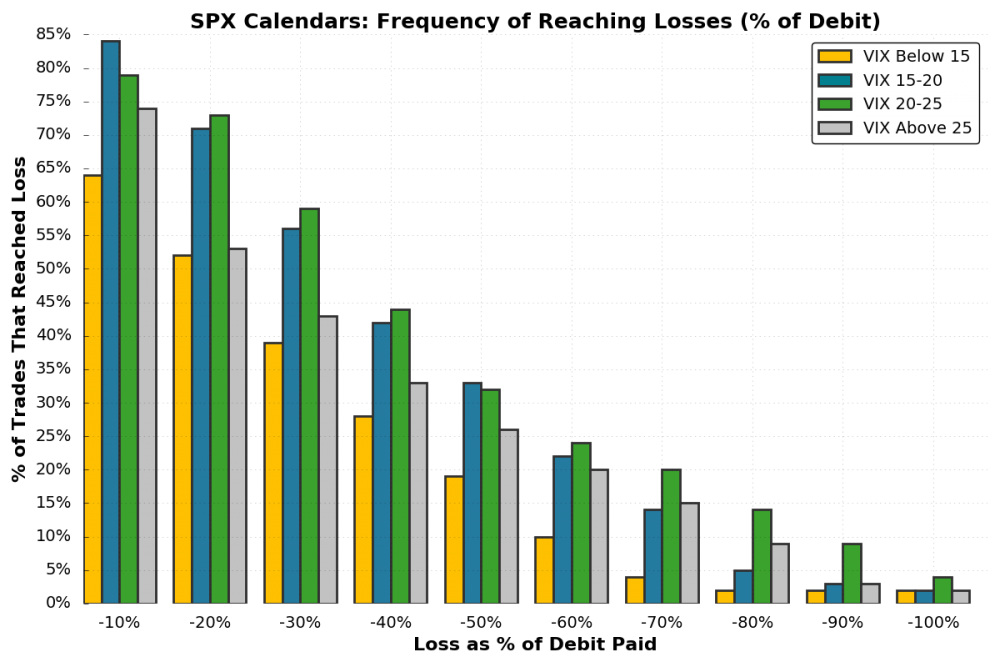
Let’s move on to the loss frequencies:

In low IV environments, the SPX calendar spreads reached each loss level less frequently than in higher IV environments. Again, this is most likely due to the fact that realized volatility tends to be more significant in times of high implied volatility.
When you compare the calendar spread profit frequencies to the loss frequencies, we can see that the biggest gap (profit frequency – loss frequency) is typically in the low IV (VIX below 15) trades. For example, in the low IV bucket, over 85% of positions reached a 10% profit, while 65% reached a 10% loss.
In the 15-20 VIX trades, 75% of trades reached a 10% profit, while 85% reached a 10% loss.
Of course, you’d like to see a large gap between the percentage of trades that hit each profit and loss level (more trades reach the profit level as opposed to the loss level).
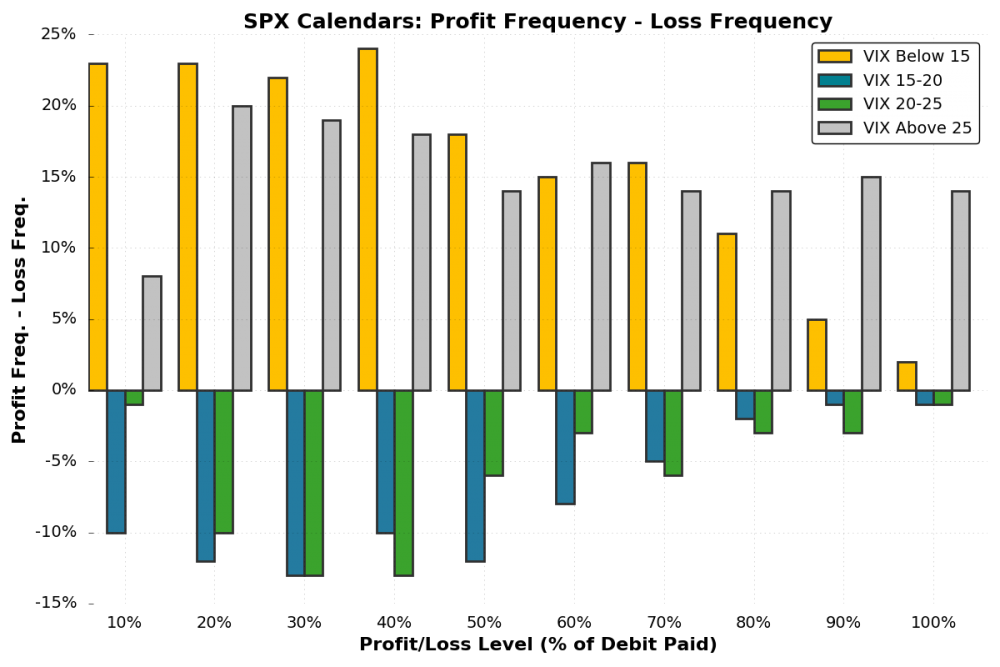
To visualize this, we simply subtracted the loss frequency from the profit frequency at each level:

As we can see, the calendars entered when the VIX was between 15 and 25 reached the loss levels more frequently than the same profit level (resulting in a negative value).
In the low (VIX below 15) and high (VIX above 25) volatility environments, the SPX calendar spreads reached the profit levels more often than the same loss level.
Summary
What can we learn from this calendar spread profit and loss data? First and foremost, calendar spreads typically perform very well in extremely low implied volatility environments, but they also have potential when front-month IV is inflated at a significant premium to the back-month IV. However, there are strategies that may be more suitable for time when implied volatility is high.
Second, based on a positive spread between profit and loss frequencies, calendar spreads have historically had positive expectancy at each profit/loss level, as profits have occurred more often than losses of the same magnitude.
On a final note, it’s important to keep in mind that this is a backtest based on closing values. As a result, it’s likely that there were trades that hit profit or loss levels intraday, but ended the day less than those levels.
Additionally, these positions were not managed, which is the key to success when trading calendar spreads. At the very least, the data discussed in this post can help to guide management levels, and expectations for achieving certain profit/loss levels when trading SPX calendars.
About the Author
Chris Butler is the founder of projectoption, an options trading education and research website. Chris primarily trades non-directional options strategies in equity indices (SPX, RUT, /ES Options), but is also active in volatility-related ETNs (VIX Options, VXX, XIV).
What Is SteadyOptions?
Full Trading Plan
Complete Portfolio Approach
Diversified Options Strategies
Exclusive Community Forum
Steady And Consistent Gains
High Quality Education
Risk Management, Portfolio Size
Performance based on real fills
Non-directional Options Strategies
10-15 trade Ideas Per Month
Targets 5-7% Monthly Net Return
Recent Articles
Articles
Pricing Models and Volatility Problems
Most traders are aware of the volatility-related problem with the best-known option pricing model, Black-Scholes. The assumption under this model is that volatility remains constant over the entire remaining life of the option.
By Michael C. Thomsett, August 16

- Added byMichael C. Thomsett
- August 16
Option Arbitrage Risks
Options traders dealing in arbitrage might not appreciate the forms of risk they face. The typical arbitrage position is found in synthetic long or short stock. In these positions, the combined options act exactly like the underlying. This creates the arbitrage.
By Michael C. Thomsett, August 7

- Added byMichael C. Thomsett
- August 7
Why Haven't You Started Investing Yet?
You are probably aware that investment opportunities are great for building wealth. Whether you opt for stocks and shares, precious metals, forex trading, or something else besides, you could afford yourself financial freedom. But if you haven't dipped your toes into the world of investing yet, we have to ask ourselves why.
By Kim, August 7

- Added byKim
- August 7
Historical Drawdowns for Global Equity Portfolios
Globally diversified equity portfolios typically hold thousands of stocks across dozens of countries. This degree of diversification minimizes the risk of a single company, country, or sector. Because of this diversification, investors should be cautious about confusing temporary declines with permanent loss of capital like with single stocks.
By Jesse, August 6

- Added byJesse
- August 6
Types of Volatility
Are most options traders aware of five different types of volatility? Probably not. Most only deal with two types, historical and implied. All five types (historical, implied, future, forecast and seasonal), deserve some explanation and study.
By Michael C. Thomsett, August 1

- Added byMichael C. Thomsett
- August 1
The Performance Gap Between Large Growth and Small Value Stocks
Academic research suggests there are differences in expected returns among stocks over the long-term. Small companies with low fundamental valuations (Small Cap Value) have higher expected returns than big companies with high valuations (Large Cap Growth).
By Jesse, July 21

- Added byJesse
- July 21
How New Traders Can Use Trade Psychology To Succeed
People have been trying to figure out just what makes humans tick for hundreds of years. In some respects, we’ve come a long way, in others, we’ve barely scratched the surface. Like it or not, many industries take advantage of this knowledge to influence our behaviour and buying patterns.

- Added byKim
- July 21
A Reliable Reversal Signal
Options traders struggle constantly with the quest for reliable reversal signals. Finding these lets you time your entry and exit expertly, if you only know how to interpret the signs and pay attention to the trendlines. One such signal is a combination of modified Bollinger Bands and a crossover signal.
By Michael C. Thomsett, July 20

- Added byMichael C. Thomsett
- July 20
Premium at Risk
Should options traders consider “premium at risk” when entering strategies? Most traders focus on calculated maximum profit or loss and breakeven price levels. But inefficiencies in option behavior, especially when close to expiration, make these basic calculations limited in value, and at times misleading.
By Michael C. Thomsett, July 13

- Added byMichael C. Thomsett
- July 13
Diversified Leveraged Anchor Performance
In our continued efforts to improve the Anchor strategy, in April of this year we began tracking a Diversified Leveraged Anchor strategy, under the theory that, over time, a diversified portfolio performs better than an undiversified portfolio in numerous metrics. Not only does overall performance tend to increase, but volatility and drawdowns tend to decrease:
Thursday, January 21, 2021